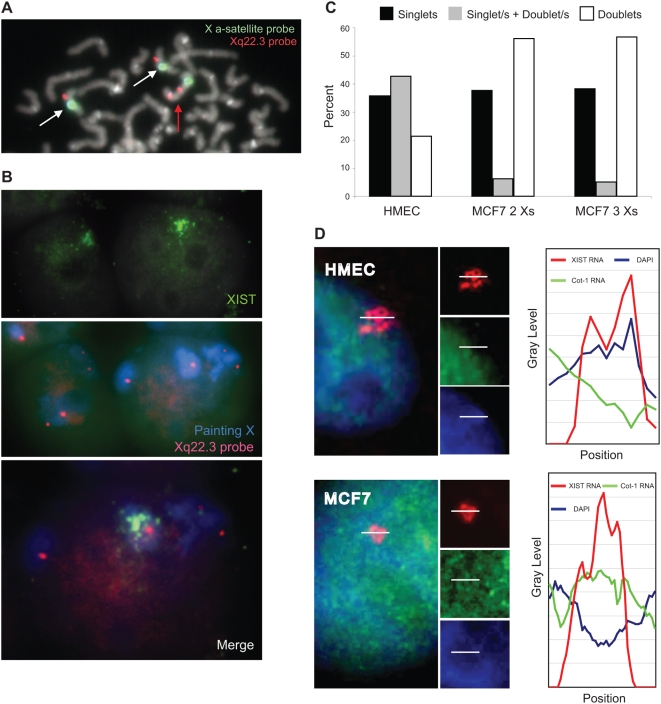
Figure 5. XIST RNA cloud paints an active X chromosome in MCF7 nuclei.
A) DNA FISH using the single Xq22.3 locus RP11-349A16 probe (red), and X alpha-satellite probe (green). Cell populations with three Xs display two different hybridization patterns: two Xs with a single red spot (white arrows) and a chromosome with two red signals (red arrow). B) Simultaneous detection of XIST RNA (green), X chromosome territory (blue) and Xq22.3 locus (red). The X chromosome expressing XIST has one copy of the RP11-349A16 region (merge). C) Replication timing analysis. MCF7 and HMEC were briefly labelled with BrdU and analyzed by DNA FISH using the single Xq22.3 locus RP11-349A16 probe and by BrdU immunofluorescence. The pattern of FISH staining seen in BrdU-positive cells was scored for at least 300 nuclei of each cell type: nuclei with only “singlets” are those in which no Xs has yet replicated; nuclei with “singlet/s+doublet/s” pattern contain unreplicated and replicated Xs; nuclei with only “doublets” have all replicated Xs. Both MCF7 subpopulations with two and three Xs display a synchronous replication timing. D) Characterisation of the chromatin signatures of XIST-positive X chromosome in MCF7 and HMEC, by simultaneous FISH detection of XIST RNA (red) and Cot-1 RNA (green); DAPI nuclear staining is in blue. A line scan of fluorescence intensity (white bars) is shown for both cell types. In HMEC, the scan plot revealed overlap of the DAPI and XIST RNA signals, whereas the Cot-1 RNA signal is depleted, as expected for an inactive X chromosome. On the contrary, in MCF7 cells the line scan through the XIST-positive territory shows high intensity of the Cot-1 RNA signal combined with low DAPI intensity, typical signs of euchromatin.

