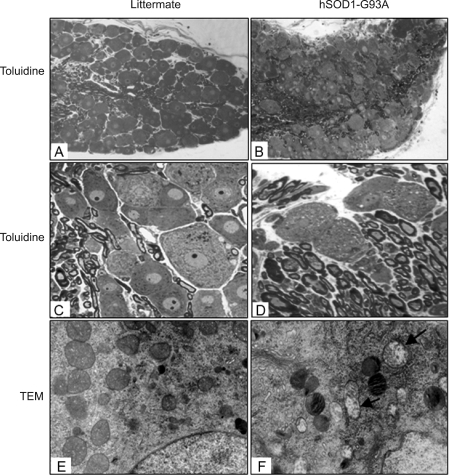
Figure 5.
DRG degeneration in hSOD1-G93A mice. Tissues were obtained from hSOD1-G93A mice at end stage and their non-transgenic littermates at the same age. A-D: Toluidine blue staining. A and B: 100×; C and D: 400×. E and F: transmission electron microscopy. Arrows indicate swollen mitochondria in the DRG neurons of hSOD1-G93A mice. 15,000×.

