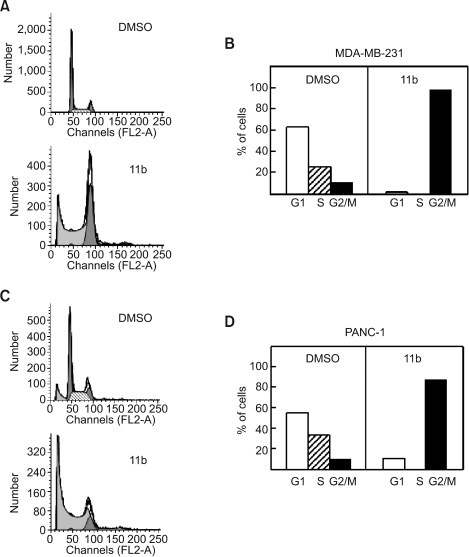
Figure 3.
Flow cytometric analysis of MDA-MB-231 and PANC-1 cells. Cells were treated with 10 µM 11b for 24 h and then stained with propidium iodide (PI). Cell cycle distributions of MDA-MB-231 (A) and PANC-1 cells (C) were analyzed using FACS and the proportion of stained cells in the G1, S and G2/M phases in MDA-MB-231 (B) and PANC-1 cells (D) were measured.

