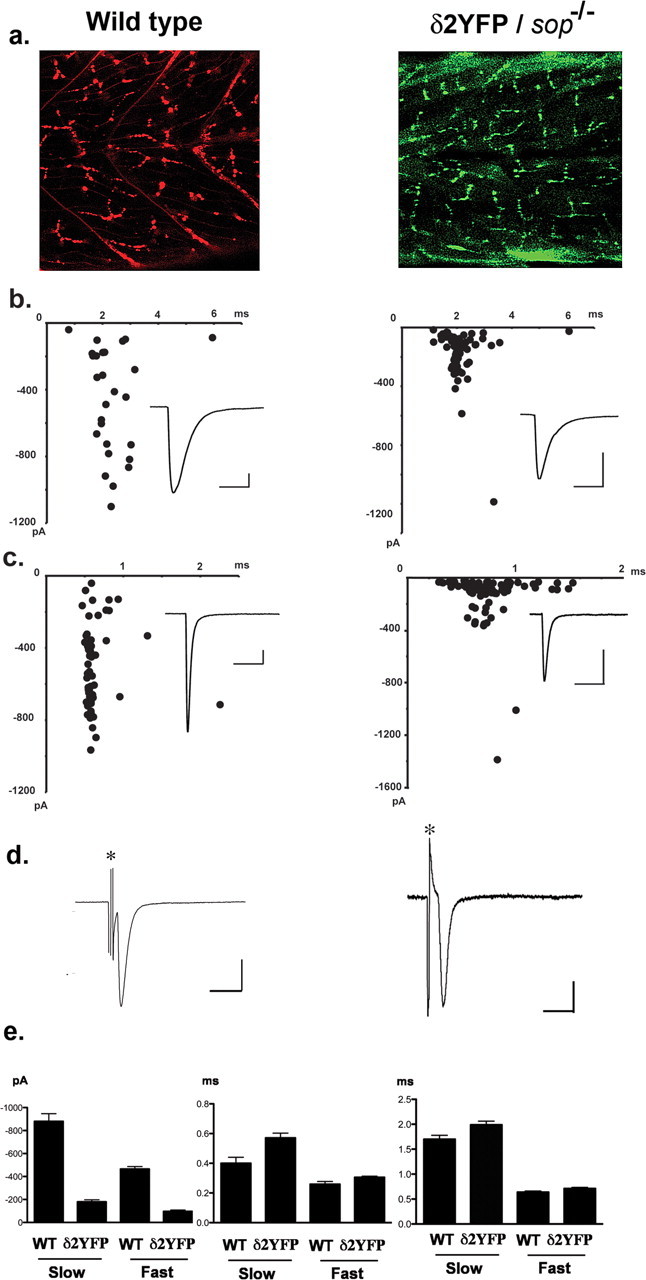
Figure 5.

a, Confocal images showing the distribution of AChR clusters in wild-type embryos visualized by α-Btx (left), and the distribution of AChR clusters visualized by YFP in δ2YFP/sop−/− embryo, stably expressing δ2YFP (right). Both images were obtained at 3dpf. b, mEPCs recorded from a single slow-twitch muscle cell of a wild-type embryo (left) and a δ2YFP/sop−/− embryo (right) at 3dpf. Amplitude and decay time constant of individual mEPCs are plotted. Averaged traces are shown as insets. Calibration: 50 pA, 6 ms. c, mEPCs recorded from a single fast-twitch muscle cell of a wild-type embryo (left) or a δ2YFP/sop−/− embryo (right). Amplitude and decay time constant of individual mEPCs are plotted. Averaged traces are shown as insets. Calibration: 50 pA, 6 ms. d, EPC recordings in response to spinal cord stimulation. Stimulation artifacts are marked with asterisks. Calibration: 500 pA (wild type), 200 pA (δ2YFP/sop−/−), 5 ms. e, Accumulated data of fast-twitching and slow-twitching muscle cells from wild-type and δ2YFP/sop−/− embryos. Current amplitude (left), rise time (middle) and decay time constant (right) of mEPCs are shown. Bar graphs represent the mean, and error bars are SEM.
