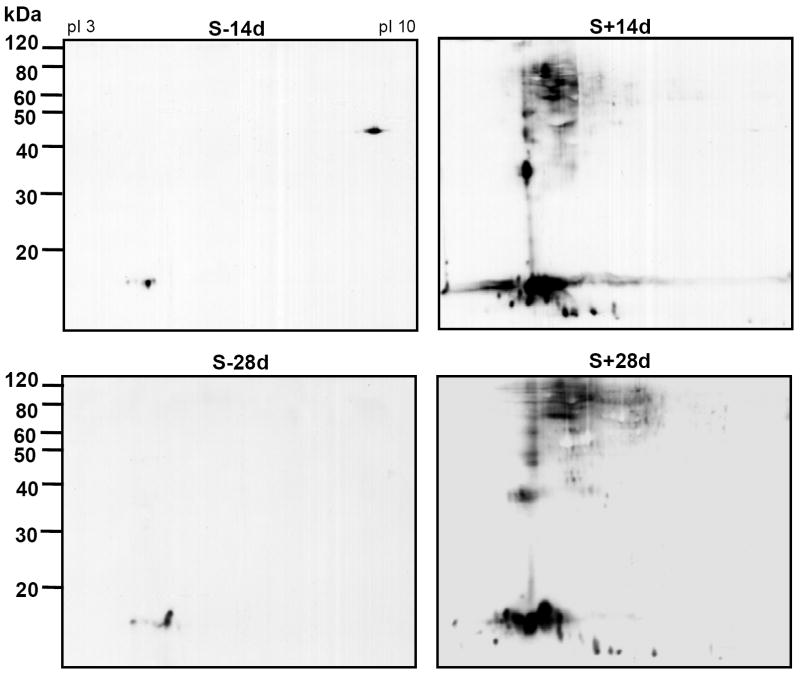
Figure 2. Induced α-Syn expression leads to accumulation of α-Syn and its derivatives exhibiting different isoelectric points and apparent molecular weights.
SN1 fractions from 1.5 × 10⁶ 3D5 cells with or without TetOff induction of α-Syn were separated by 2-D gel electrophoresis and analyzed by Western blotting using Syn1 antibody. S-14d or S-28d: without induction for 14 days or 28 days. S+14d or S+28d: with induction for 14 days or 28days. In the S-14d the spot shown at pI 10 and migrated around 50 kDa is unrelated to α-Syn, since it was not recognized by other antibodies to α-Syn (n=3).

