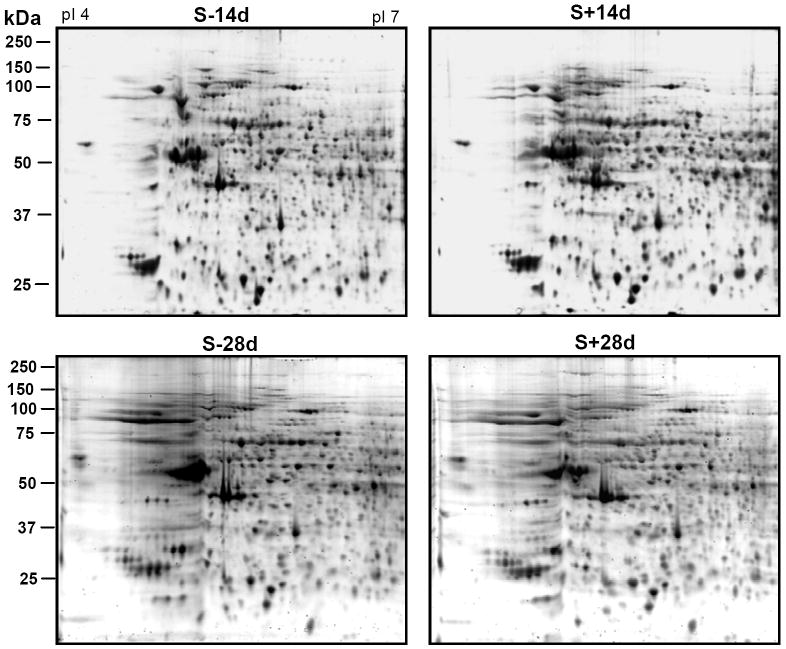
Figure 3. Profiling of proteins from cells with or without induced α-Syn expression and assembly.
SN1 fractions containing equal amount of protein from 3D5 cells (1.5 × 10⁶) induced to express α-Syn for 14 or 28 days or their non-induced controls were separated by 2-D gel electrophoresis and stained with Sypro ruby stain. About 400 spots were reproducibly observed in each sample. No significant differences were detected between the S-14d and S+14d samples or between the S-28d and S+28d samples.

