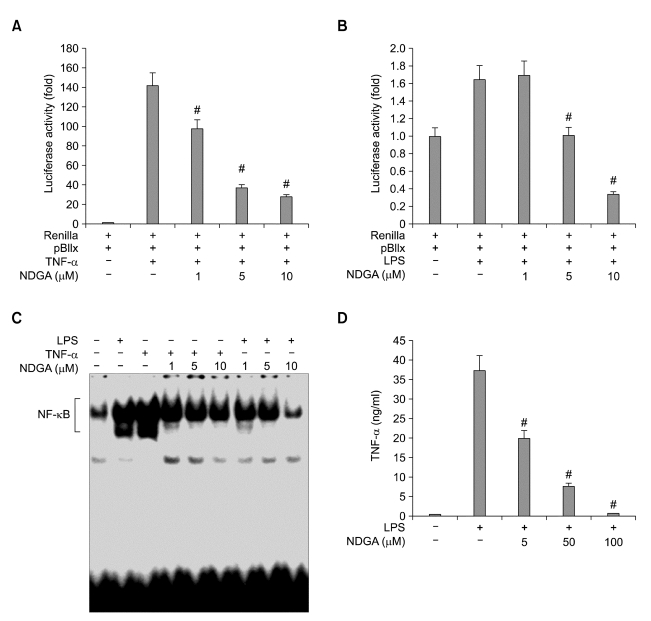
Figure 3.
NDGA inhibits TNF-α and LPS-induced NF-κB activation and LPS-mediated TNF-α production. (A) and (B) RAW 264.7 cells transfected (in 24-well plates) with a κB-luciferase reporter (100 ng) and a control Renilla luciferase reporter. The cells were pre-treated with different NDGA concentrations as indicated for 1 h, then stimulated for 5 h with 1 ng/ml TNF-α (A) or 1 µg/ml LPS (B). The luciferase assay was conducted as described in the Materials and Methods section. NF-κB-specific luciferase activity was normalized on the basis of the Renilla luciferase control. The results are expressed as the fold induction in luciferase activity relative to that of untreated cells. Error bars indicate standard deviation. *P < 0.05 vs NDGA-no-treated control. (C) Raw 264.7 cells were treated with different NDGA concentrations as indicated for 1 h, stimulated for 5 h with 1 ng/ml TNF-α or 1 ng/ml LPS, and the nuclear extracts were prepared. NF-κB DNA-binding activity was analyzed via EMSA as described in the Materials and Methods section. (D) Raw 264.7 cells were treated with different concentrations of NDGA as indicated for 1 h, and stimulated for 5 h with 1 µg/ml LPS. The quantity of TNF-α in the culture supernatant fractions was determined via ELISA, as described in the Materials and Methods section. Error bars indicate standard deviation. *P < 0.05 vs NDGA-no-treated control.

