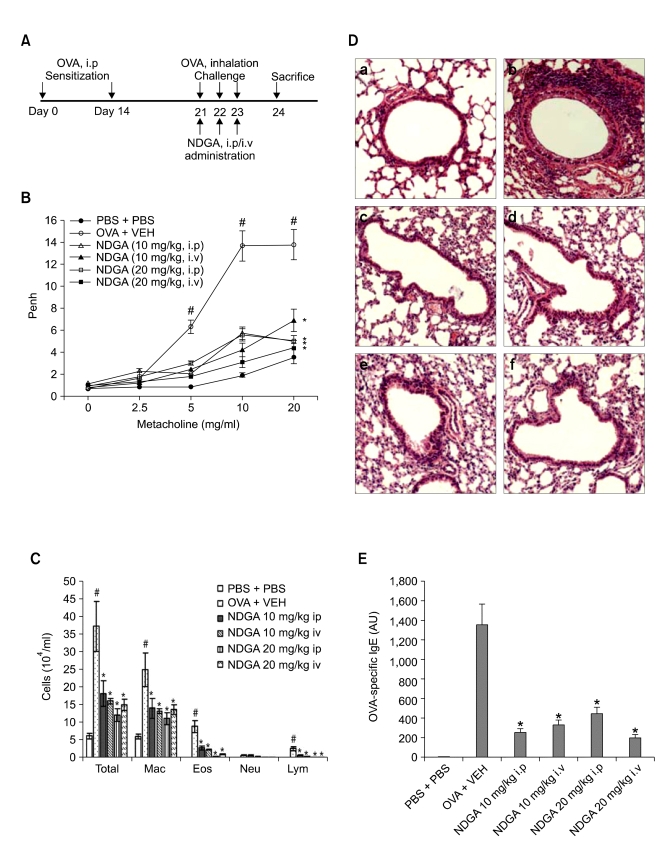
Figure 4.
NDGA attenuates airway hyperresponsiveness and inflammation in a murine asthma model. (A) Six-week-old male BALB/c mice were sensitized on days 1 and 14 via intraperitoneal injection of 20 µg OVA emulsified in 1 mg Al(OH)3 (alum), followed by an identical booster injection on day 14. On days 21, 22, and 23 after initial sensitization, the mice were challenged for 30 min with an aerosol of 5% OVA (wt/vol in PBS) using an ultrasonic nebulizer. NDGA (10 mg/kg and 20mg/kg) or vehicle control (0.05% DMSO) diluted with 0.9% NaCl, was administered either intraperitoneally or intravenously in a volume of 50 µl in triplicate to each animal on days 21, 22, and 23. (B) Airway hyperresponsiveness was measured 24 h after the last challenge in saline-inhaled mice to which PBS was administered (PBS + PBS), OVA-inhaled mice to which drug vehicle was intraperitoneally administered (OVA + VEH), OVA-inhaled mice to which 10 mg/kg NDGA was intraperitoneally administered (NDGA 10 mg/kg i.p), OVA-inhaled mice to which 10 mg/kg NDGA was intravenously administered (NDGA 10 mg/kg i.v), OVA-inhaled mice to which 20 mg/kg NDGA was intraperitoneally administered (NDGA 20 mg/kg i.p), and OVA-inhaled mice to which 20 mg/kg NDGA were intravenously administered (NDGA 20 mg/kg i.v), as described in the Materials and Methods. Data represent mean ± SE from 6 independent experiments. #P < 0.05 vs PBS + PBS mice and *P < 0.05 vs OVA + VEH mice. (C) The number of total cells and differential cellular component of BAL fluids from each of the mice described above were counted 24 h after the last challenge. Differential cell counts were conducted on a minimum of 400 cells in each of four different random locations to identify macrophages (Mac), eosinophils (Eos), neutrophils (Neu), and lymphocyte (LyM). Bars represent mean ± SE from 6 independent experiments. #P < 0.05 vs PBS + PBS mice and *P < 0.05 vs OVA + VEH mice. (D) Lung tissue was fixed, sectioned to a thickness of 4 µM and stained as described in the Materials and Methods section (a, PBS + PBS; b, OVA + VEH, c, NDGA 10 mg/kg i.p; d, NDGA 10 mg/kg i.v; e, NDGA 20 mg/kg i.p; f, NDGA 20 mg/kg i.v). (E) Mouse serum samples were collected 24 h after the last challenge. The levels of OVA-specific IgE were analyzed using ELISA. Bars represent mean ± SE from 6 independent experiments. *P < 0.05 vs OVA + VEH mice.

