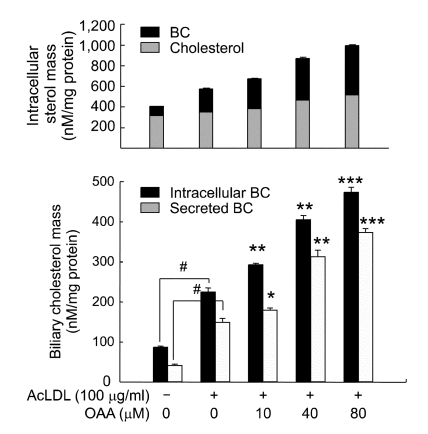
Figure 4.
ACAT inhibition increases the mass of intracellular and secreted BC in cultured macrophages. The effect of ACAT inhibition on the production of BC was measured in the macrophages treated as described for Figure 2. (A) Intracellular cholesterol mass and biliary cholesterol mass are compared in the same graph. (B) The intracellular and secreted BC mass were analyzed and calculated as described in Materials and Methods. #P < 0.01 versus control cells; *P < 0.05, **P < 0.01, ***P < 0.001 versus acLDL-loaded cells.

