Figure 6.
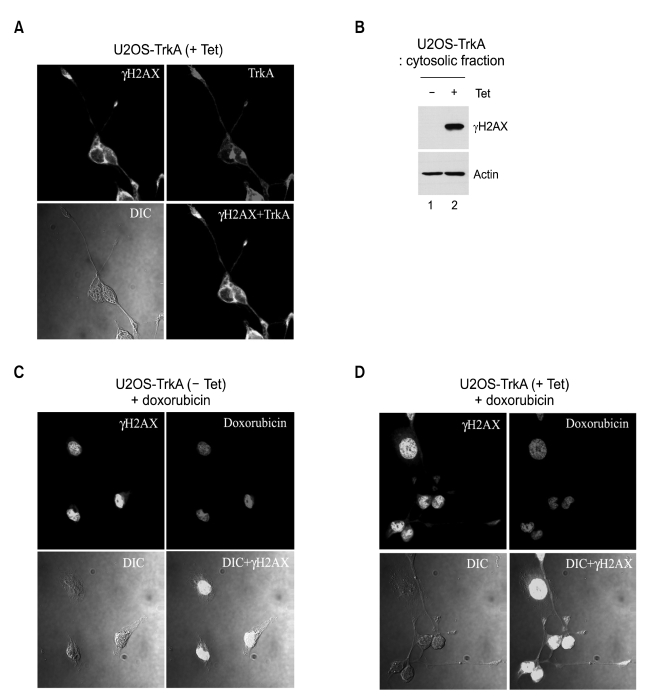
Cytosolic accumulation of γH2AX by TrkA. (A) U2OS-TrkA-67 cells were induced with tetracycline for 16 h. γH2AX was stained with FITC-labelled green and TrkA was stained with TRITC-labelled red and analyzed by confocal immunofluorescence microscopy. γH2AX+TrkA panel shows merged image of γH2AX and TrkA panels. (B) Western blot was performed in cytosolic fractions of uninduced and TrkA-induced U2OS cells. (C, D) U2OS-TrkA-67 cells were uninduced (C) or induced (D) with tetracycline for 12 h and treated with doxorubicin (1 µg/ml) for 4 h. γH2AX was stained with FITC-labelled green and doxorubicin was imaged in TRITC visible region by confocal immunofluorescence microscopy. DIC+γH2AX panel shows merged image of DIC and γH2AX panels.

