Figure 1.
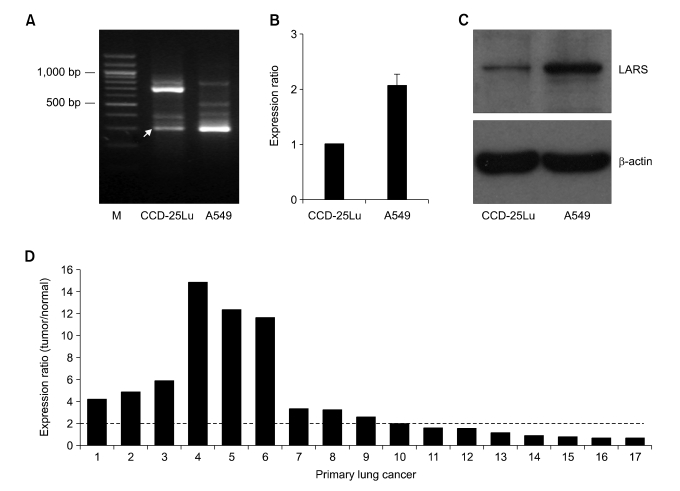
Over-expression of LARS1 gene in lung cancer cells. (A) Total RNA of CCD-25Lu and A549 cells were used for ACP-based GeneFishing analysis as described in Materials and Methods. The amplicon bands showing different intensities between two cell lines were re-amplified and sequenced for gene annotation. Arrow indicates a DEG band turned out to be LARS1. (B) Expression level of LARS1 in each cell was determined by qRT-PCR as described in Materials and Methods. As an internal control, GAPDH mRNA was used. (C) Cell lysates of CCD-25Lu and A549 cells were used for immunoblot analysis with anti-LARS1 antibody. β-actin was probed for equal protein loading. (D) Expression level of LARS1 in 17 primary lung cancer samples was determined by qRT-PCR as described in Materials and Methods. Ten of the 17 primary cancers showed over two fold up-regulation of LARS1 (criteria of over-expression in this study) compared to normal control lung tissues.

