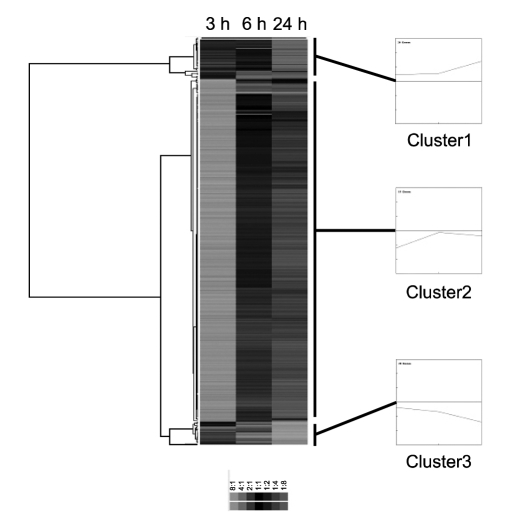
Figure 2.
Hierarchical clustering of genes that were significantly up- or down-regulated by kaempferol treatment. Differentially-expressed genes were clustered hierarchically based on similarities in their expression profiles. The expression pattern of each gene is displayed as a horizontal strip. The color scale is indicated below. Clusters 1-3 are defined according to their gene expression patterns, and the log ratio values of genes for each class are presented as line graphs.

