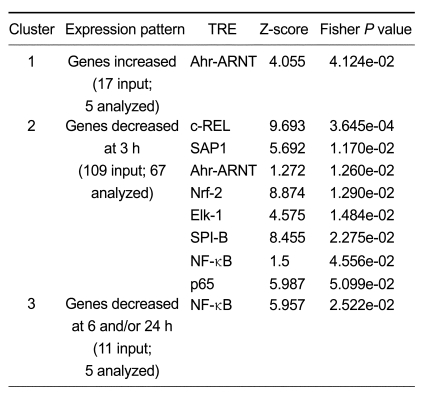
Table 2.
Over-represented TREs in the promoters of differentially-expressed genes following treatment with Kaempferol.
Promoter analysis was performed using oPOSSUM v1.3 (Ho Sui et al., 2005), a web-based promoter motif detection and statistical methods for identification of over-represented transcription response elements (TREs) in the promoters of gene set. 2,000 bp upstream and 500 bp downstream of the transcription start site (TSS) for each differentially-expressed gene were analyzed. The level of conservation with the aligned orthologous mouse sequence was set to level 1 (the top 10 percentile of non-coding conserved regions with an absolute minimum percent identity of 70%). Two measures of statistical over-representation were used: a Z-score and a one-tailed Fisher exact probability. TREs with the mostly highly ranked Z-scores or with Fisher P-value < 0.05 were listed. See (Ho Sui et al., 2005) for how the Z-score and Fisher P-values were calculated.

