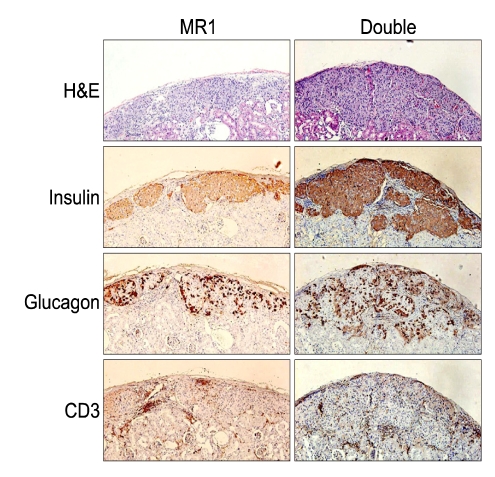
Figure 7.
Comparison of islet allograft histology in recipients from 2 of the treatment groups (displayed in vertical columns). Functioning islet allografts in the renal subcapsular space of diabetic C57BL/6 mice were removed on day 164 after transplantation. Line 1, hematoxylin/eosin staining (H&E). Other lines show immunoperoxidase staining for antibodies to insulin (line 2), glucagons (line 3), and CD3 (line 4) (magnification × 100). Histological sections for each marker are representative of two to seven live animals from each treatment group.

