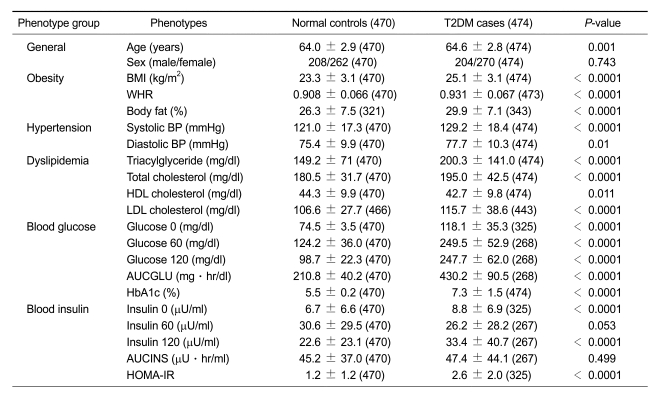
Table 1.
Clinical profile of study subjects.
Values are mean ± standard deviation (SD). Values in parentheses are the number of subjects assessed for each clinical profile. P values: T2DM cases versus normal controls. (BMI, body mass index; WHR, waist hip ratio; BP, blood pressure; Glucose 0, fasting plasma glucose level; Glucose 60 and 120, plasma glucose level 60 and 120 min after glucose ingestion, respectively; Insulin 0, fasting plasma insulin level; Insulin 60 and insulin 120, plasma insulin level 60 and 120 min after glucose ingestion, respectively; AUCGLU, glucose area under the curve; AUCINS, insulin area under the curve; HbA1C, glycosylated hemoglobin; HOMA-IR, homeostasis model assessment-insulin resistance; HDL, high density lipoprotein; LDL, low density lipoprotein).

