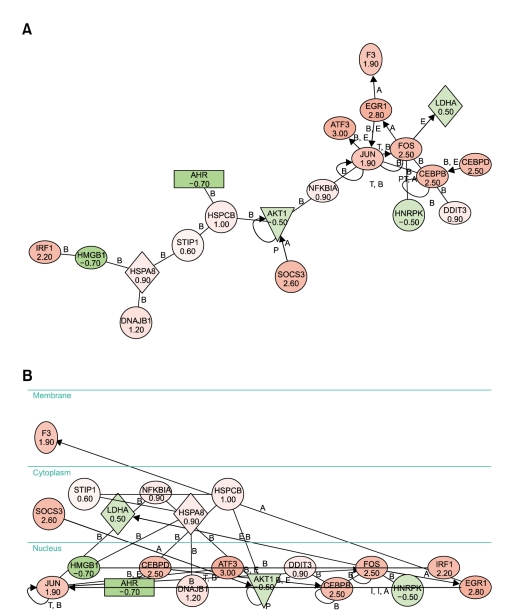
Figure 4.
Graphic view of biological network 1, which was generated using the Ingenuity Pathway Analysis program. Genes with a log2 ratio of 0.5 or greater and -0.5 or lower were used to generate biological networks in Rhok-/- mice exposed to 1 h of 2,000 lux and 3 h of dark adaptation. Pink and red denote the up-regulated genes while dark and light green correspond to the downregulated genes. (A) Spatial layout. (B) Subcellular layout.

