Figure 2.
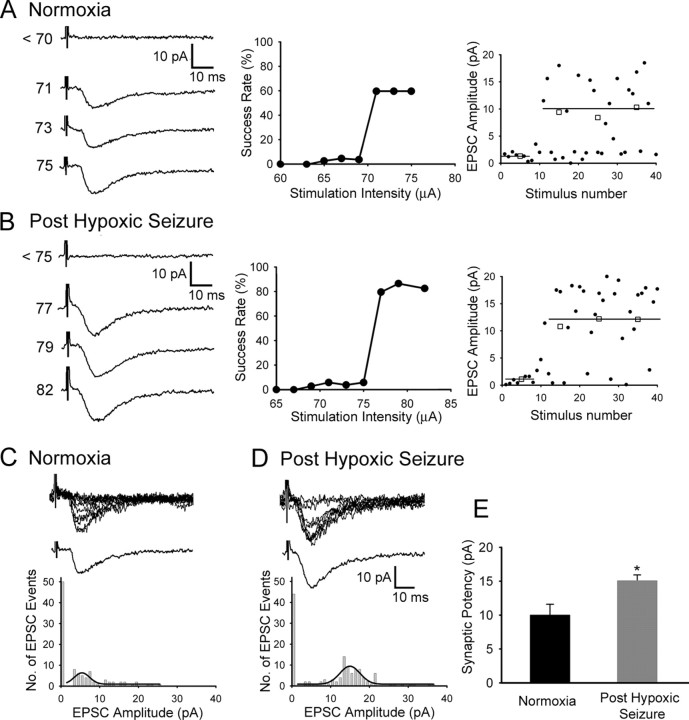
Increased synaptic potency in minimally evoked AMPAR-mediated EPSCs after hypoxic seizures. A, B, Left, Representative traces from single-fiber stimulation showing averaged unitary EPSCs at increasing stimulus intensities in CA1 pyramidal neurons in slices from normoxic control pups (A) and those removed at 1 h after hypoxic seizures (B). Middle, Stimulation profile of success rate of minimally evoked EPSCs as a function of stimulus intensity in slices from controls (A) and in those removed at 1 h after seizures (B). An abrupt threshold and a stable plateau for single axon fiber stimulation are observed in both conditions. Right panels in A (control) and B (after HS) show the corresponding individual EPSC event amplitude during the course of the experiment plotted against consecutive stimulus number. Averaged (□) and individual single response (●) amplitudes are plotted with a solid line, illustrating averaged EPSC amplitudes. C, D, Minimally evoked AMPAR-mediated EPSCs in slices from normoxic controls (C) and slices removed at 1 h after seizures (D). Top traces show 10 superimposed consecutive responses, and bottom traces show averaged successful EPSCs [synaptic potency, mean amplitude/(1 − failure rate)]. Bottom panels shows amplitude distribution histogram of EPSC events (n = 5 cells for each group) with a line showing the fitted Gaussian distribution of successful EPSC events. The amplitude distribution histogram shows a shift to the right in recordings from slices removed after hypoxic seizures. E, Neurons from slices removed after hypoxic seizures exhibited significant increase in synaptic potency (15.07 ± 0.87 pA; n = 5; *p < 0.05) compared with normoxic control (10 ± 1.59 pA; n = 5). Error bars indicate SEM.

