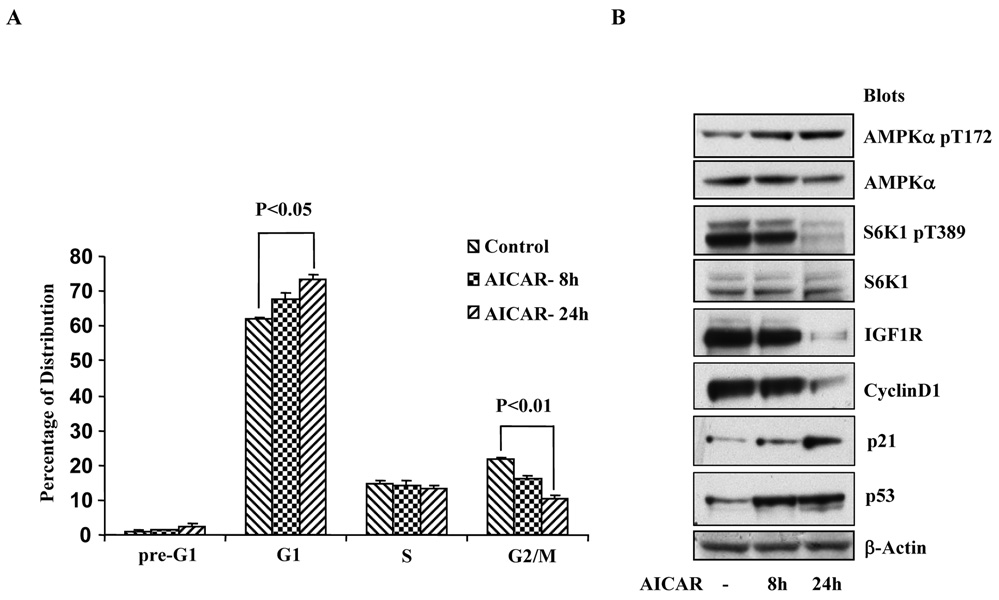
Figure 2. The effect of AICAR on cell cycle profiles.
The same number of C4-2 cells (105 cells) was plated one day before treatment with or without AICAR for 8 and 24 hours and subjected to FACS analysis (A), and Western blot with antibodies, as indicated (B). The graph represents mean±STDV of a triplicate experiment (two-tailed t tests).

