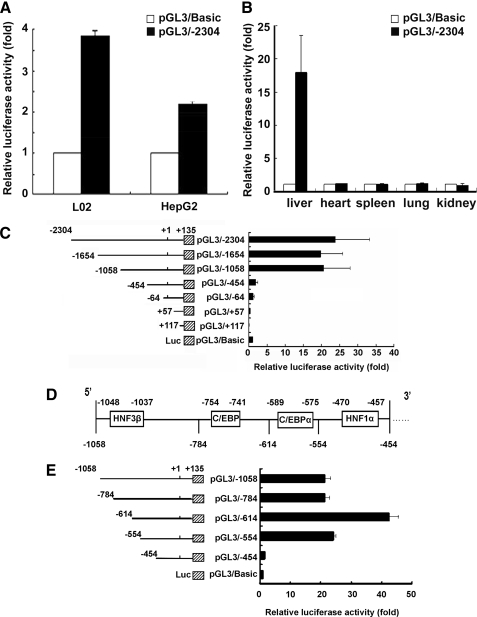
FIGURE 2.
Functional analysis of the HPS promoter in HepG2 cells, L02 cells and mouse liver, and deletion mapping of the HPS promoter. A, nearly 2.4 kb of the 5′-flanking sequence upstream of the HPS promoter was cloned into pGL3/Basic vector (–2304 to +135). 500 ng of pGL3/–2304 or the empty pGL3/Basic vector alone were transfected into L02 cells or HepG2 cells. B, 5 μg of pGL3/–2304 were transfected into the mouse as described under “Experimental Procedures.” 24 h later, the kidney, liver, spleen, lung, and heart were excised, weighed, lysed, and assayed for luciferase activity. C, 5 μg of pGL3/–2304 and six progressive 5′ nested deletions, termed pGL3/–1654 (–1654 to +135), pGL3/–1058 (–1058 to +135), pGL3/–454 (–454 to +135), pGL3/–64 (–64 to +135), pGL3/+57 (+57 to +135), and pGL3/+117 (+117 to +135), were transfected into mouse liver, respectively. Left, schematic diagrams of the various HPS deletion constructs; right, graphical representation of relative luciferase activity. D, schematic representation of 5′-flanking sequence from –1058 to –454 bp. E, effects of deletions of HNF3β, CEBPα, and HNF1α elements in the HPS gene promoter on hepatocyte-specific expression. 5 μg of pGL3/–784 (–784 to +135), pGL3/–614 (–614 to +135), pGL3/–554 (–554 to +135), or pGL3/–454 (–454 to +135), respectively, were transfected into the mouse livers. All luciferase activity assays were performed 24 h post-transfection. The values were normalized to Renilla luciferase activity that was transfected concurrently in all of the assays to correct for transfection efficiency. Relative luciferase activity was expressed as means ± S.E. of triplicate measurements for the same assay (p < 0.05).

