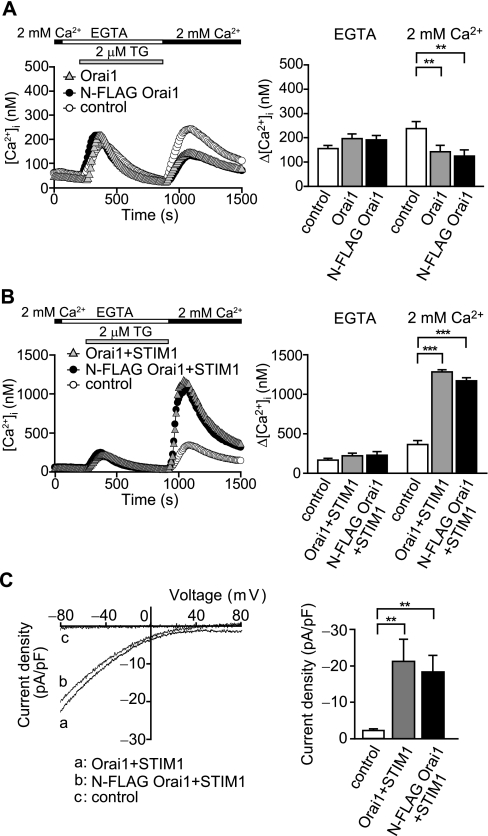
FIGURE 1.
Functional analysis of the N-FLAG-tagged Orai1 channel. A, thapsigargin (TG)-induced [Ca2+]i rises in Orai1-expressing HEK293 cells. Left, average time course of Ca2+ responses induced by 2 μm TG in Orai1 (gray triangles)-, N-FLAG-tagged Orai1 (black circles)-, and control vector (white circles)-transfected HEK293 cells (n = 27–28). The perfusion solution was first changed to 0.5 mm EGTA containing Ca2+-free HBS (EGTA), and 2 μm TG was applied to the cells in the absence of extracellular Ca2+. Eleven minutes after the application of TG, 2 mm Ca2+ was added to the extracellular solution. Right, maximum [Ca2+]i rises (Δ[Ca2+]i) induced by TG in EGTA and those after re-addition of 2 mm external Ca2+. B, TG-induced [Ca2+]i rises in Orai1 and STIM1-coexpressing HEK293 cells. Left, average time course of Ca2+ responses induced by 2 μm TG in Orai1 plus STIM1 (gray triangles)- and N-FLAG-tagged Orai1 plus STIM1 (black circles)-cotransfected HEK293 cells and control vector (white circles)-transfected HEK293 cells (n = 25–41). Right, Δ[Ca2+]i induced by TG in EGTA and those after re-addition of 2 mm external Ca2+. C, activation of CRAC current induced by 40 μm IP3 in Orai1- and STIM1-coexpressing cells. Left, representative current-voltage relationships in Orai1 plus STIM1 (a)- and N-FLAG-tagged Orai1 plus STIM1 (b)-cotransfected HEK293 cells and control vector (c)-transfected HEK293 cells. Data represent leak-subtracted current densities (pA/picofarad) evoked by 50-ms voltage ramps from -100 to +100 mV. Right, average CRAC current densities at -80 mV in Orai1 plus STIM1 (n = 11), N-FLAG-tagged Orai1 plus STIM1 (n = 9) and control (n = 9) cells. **, p < 0.01; and ***, p < 0.001.

