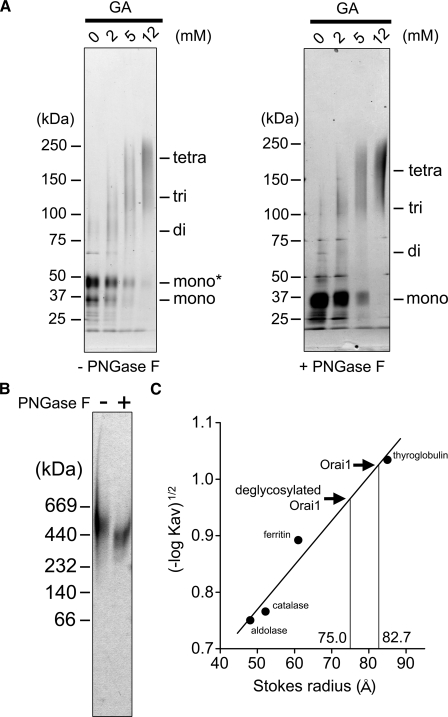
FIGURE 3.
Chemical cross-linking, native PAGE and Stokes radius of Orai1. A, chemical cross-linking of Orai1. Purified proteins with (right panel) or without (left panel) PNGase F treatment were reacted with glutaraldehyde (GA) at indicated concentrations and separated by SDS-PAGE followed by silver staining. Left, the bands of Orai1 at 36 kDa and 44 kDa were shifted upward to ∼200 kDa, suggesting glycosylated tetramer formation (44 × 4 = 176 kDa). Right, the deglycosylated band at 36 kDa was also shifted upward by the cross-linking to ∼170 kDa. B, native gel electrophoresis of Orai1. Purified proteins were separated in native gel and visualized by silver staining. The Orai1 proteins were detected as a broad band at 520 kDa, and shifted downward to 380 kDa after PNGaseF treatment. This much larger estimation of the molecular weight may suggest the swollen structure of the Orai1 molecule. C, Stokes radius (Rs) of purified Orai1 calculated from SEC. From the calibration curve obtained from the standards, the Rs of glycosylated and deglycosylated Orai1 were calculated to be 82.7 ± 1.1Å(n = 5) and 75.0 ± 1.0Å(n = 3), respectively. Standard proteins are thyroglobulin (Rs, 85 Å), ferritin (Rs, 61 Å), catalase (Rs, 52 Å), and aldolase (Rs, 48 Å).

