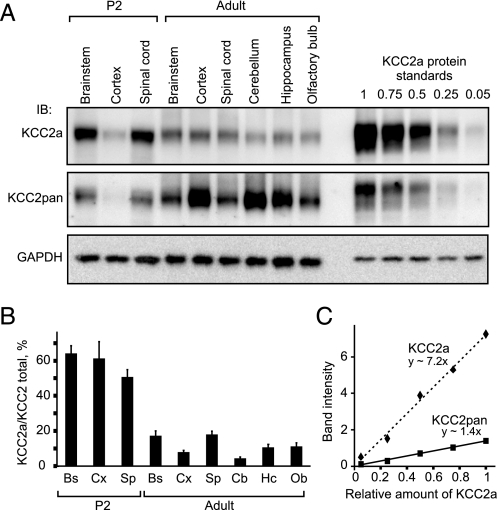
FIGURE 4.
KCC2a contributes at least half of the total KCC2 protein in the neonatal mouse, whereas KCC2b is the predominant isoform in the adult brain. A, equal amounts (20 μg) of total protein lysates obtained from spinal cords and different brain regions of P2 or adult (48-week-old) mice were analyzed in parallel with KCC2a protein standards by immunoblotting. Membrane was first immunoblotted (IB) with the KCC2a antibody (upper panel), stripped, and then processed with KCC2pan (middle panel) antibody. GAPDH expression in the samples is shown as a loading control (lower panel). B, relative (percentage) contribution of KCC2a to total KCC2 protein expression in different CNS regions of neonatal (P2) and adult mice. Shown is the result of quantification of five independent experiments, one of which is presented in A. Band intensities of the ∼140-kDa protein product, corresponding to the predicted molecular mass for KCC2a and KCC2b, were measured, and the ratio of KCC2a to total KCC2 was calculated by using standard curves (panel C, see “Experimental Procedures”). KCC2a contributes about 50–65% of the total KCC2 expression in the neonatal mouse brainstem (Bs), cortex (Cx), and spinal cord (Sp). By contrast, KCC2a is a minor KCC2 isoform in the adult CNS; the percentage of KCC2a of the total KCC2 ranges from 4% in the cerebellum (Cb) to 17–18% in the brainstem and spinal cord. Intermediate values are seen in the cortex (8%), hippocampus (Hc, 10%), and olfactory bulb (Ob, 11%). Values are mean ± S.E. (error bars) of five independent experiments. C, standard curves for the KCC2a and KCC2pan antibodies were made by plotting the concentration of the KCC2a standard (= different dilutions, from undiluted up to 1/20, of a KCC2a-expressing HEK293 cell lysate) on the x axis and the measured band intensities on the y axis and then fitting a line to the data.

