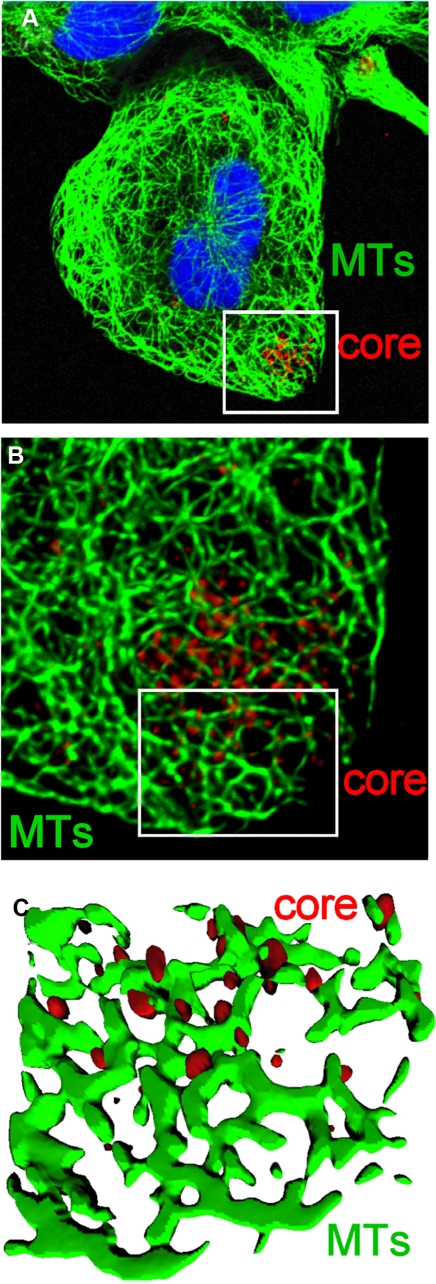
FIGURE 8.
Juxtaposition of core in HCVcc-infected cells. A, Huh7.5 cells were inoculated with medium from cells electroporated with JFH-1 RNA. Cells were stained with anti-core and anti-tubulin antibody followed by fluorochrome-labeled secondary antibodies 24 h postinoculation. Cell nuclei were counterstained with 4′,6-diamidino-2-phenylindole. B and C, Z-stack analysis of the zoomed area (white box in A). B shows a maximal intensity projection of a Z-series generated from a stack of 20 images. To remove the blurring effect due to Z-stack acquisition, the Z-series was deconvolved using a blind deconvolution protocol. The image in C is a three-dimensional reconstruction of the zoomed area (indicated by the white box). Microtubules (in green) and core protein (in red) are represented as solid isosurfaces.

