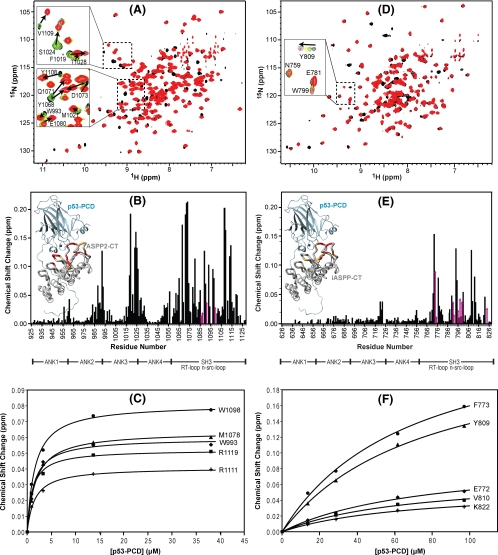
FIGURE 2.
Chemical shift mapping of the interaction between p53-PCD and ASPP2-CT and iASPP-CT. Superposition of the 1H-15N TROSY-HSQC spectra of U-15N,2H-labeled ASPP2-CT (A) and 15N,2H-labeled iASPP-CT (D) without (black) and in the presence (red) of unlabeled p53-PCD. Two selected regions are expanded, and individual resonances along the titration are shown in the inset (increasing amounts of p53-PCD are shown with the colors black → green → yellow → cyan → red). B and E, magnitude of the chemical shift changes versus residue number for ASPP2-CT and iASPP, respectively. The chemical shift change (Δδ) is calculated using the square root of ΔδHN2 + (ΔδN × 0.1)2, with ΔδHN and ΔδN representing the 1HN and 15N chemical shift differences, respectively, between free ASPP-CT (black spectrum in A and D) and the final mixture (red spectrum in A and D). Changes for residues whose resonances broaden and/or are difficult to follow through the entire titration are estimated from earlier titration points and indicated with magenta arrows. Structural mapping of the p53 binding site on ASPP2-CT and iASPP-CT is provided in the insets. Domain boundaries for ASPP2-CT and iASPP-CT are indicated below the residue numbers. The complex structures of ASPP2-CT·p53-PCD and iASPP-CT·p53-PCD were modeled based on the ASPP2-CT·p53-CD crystal structure (Protein Data Bank code 1YCS) by comparative modeling using MODELLER (46), and residues are colored according to the magnitude of their associated chemical shift changes: red, Δδ > (Δδaverage + 2 × S.D.); orange,(Δδaverage + 2 × S.D.) >Δδ > (Δδaverage + 1 × S.D.). C and F, titration curves for selected ASPP2-CT and iASPP-CT 1HN resonances, respectively.

