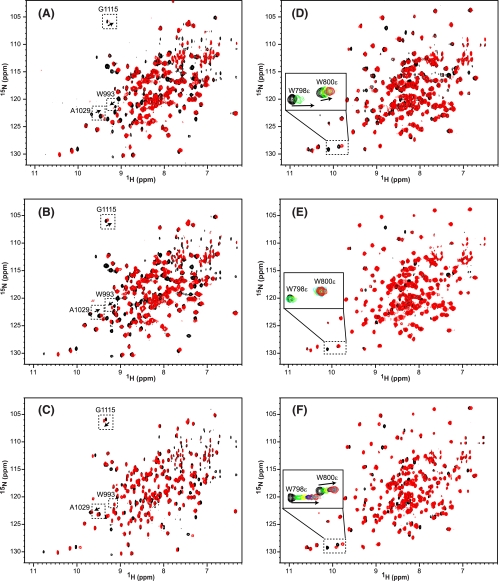
FIGURE 5.
Chemical shift mapping of the binding of different p53 constructs to ASPP2-CT and iASPP-CT. A-F, superposition of 1H-15N TROSY-HSQC spectra of U-15N,2H- or 15N,13C,2H-labeled ASPP2-CT and U-15N,2H- or 15N,13C,2H-labeled iASPP-CT in the absence (black) and presence (red) of unlabeled p53-PCD2F-L (A and D), p53-PCD2F (B and E), and p53-L (C and F). A-C, select resonances of ASPP2-CT are highlighted in dashed boxes and labeled with residue name and number. D-F, titrations of selected iASPP-CT resonances are displayed in the enlarged boxes, and the progression in the titration is shown by black → green → yellow → blue → burgundy → cyan → red contour colors.

