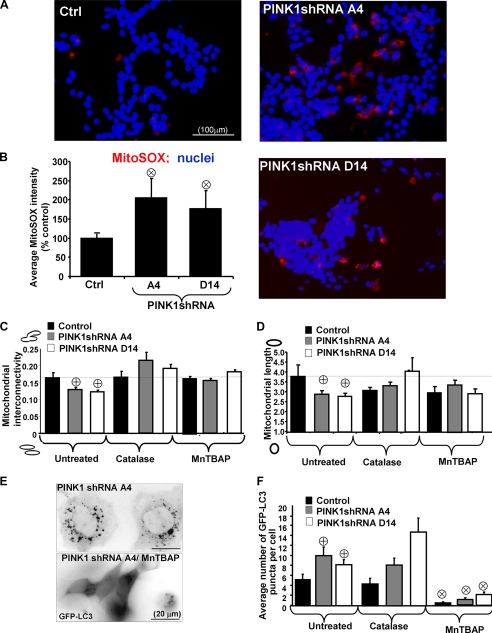
FIGURE 6.
PINK1 knockdown elicits mitochondrial superoxide upstream of
mitochondrial fragmentation and autophagy in PINK1-deficient lines.
A, epifluorescence analysis of MitoSOX, a cell-permeable red
fluorescent mitochondrial superoxide indicator, in a control stable cell line
(Ctrl, left panel) and two PINK1 knockdown cell lines (right
panels). Nuclei were counterstained with DRAQ5 (blue). Scale
bar: 100 μm. B, bar graph shows compiled means ± S.E.
from three independent experiments with increases in the average MitoSOX
fluorescence per cell normalized to vector control cell line
( , p < 0.05
versus vector control cell line; n = 200-300 cells
analyzed/condition). C and D, quantification of
mitochondrial interconnectivity (C) and mitochondrial elongation
(D) in PINK1 knockdown clonal cell lines treated with catalase,
MnTBAP, or vehicle (untreated) for 24 h. (Representative of three independent
experiments;
  , p
< 0.05 versus control cell line; n = 25-35 cells analyzed
per condition.) E, representative epifluorescence micrograph of a
PINK1 knockdown cell line (A4) transiently expressing GFP-LC3 treated in the
presence or absence of antioxidant MnTBAP. Note that MnTBAP suppresses
autophagy in PINK1 knockdown cells. F, the average cellular number of
GFP-LC3 puncta in control or PINK1shRNA cells transiently expressing GFP-LC3
in the presence or absence of indicated antioxidants.
(
 , p < 0.05
versus untreated control cell line;
 , p < 0.0001
versus respective untreated clones; representative bar graph
shows means ± S.E., n = 25-40 cells quantified/condition).

