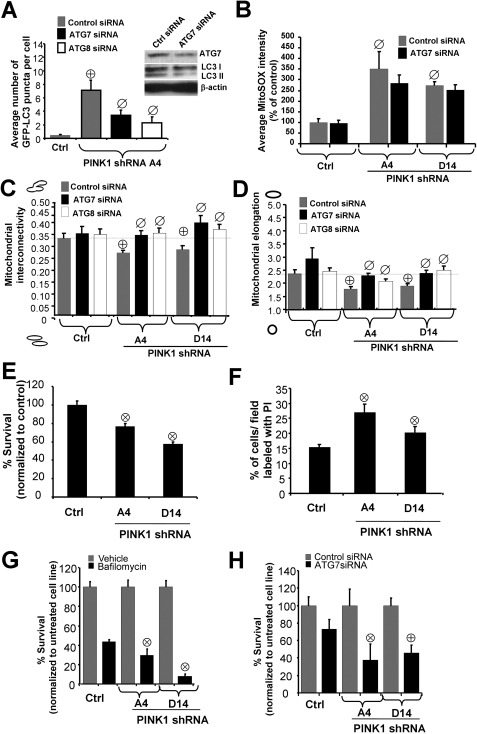
FIGURE 8.
Autophagy is involved in mitochondrial morphology changes elicited by
PINK1 deficiency and plays a neuroprotective role. A, stable
vector control or PINK1shRNA cells co-transfected with the indicated siRNAs
and quantified for the number of GFP-LC3 puncta per cell as analyzed in a
representative experiment of two
( , p < 0.001
versus control cell line;
 , p < 0.01
versus control siRNA; means ± S.E., n = 30-40 cells
quantified per condition). Inset shows a representative Western blot
showing effects of Atg7 or control siRNA. Note that knockdown of ATG7
decreases endogenous Atg7 levels and reduces the levels of activated LC3-II.
B, the average integrated intensity of MitoSOX fluorescence was
quantified in control or PINK1shRNA stable cell lines transiently transfected
with the indicated siRNAs (
 ,
p < 0.01 versus control cell line (Ctrl), means
± S.E., n = 300-400 cells/condition). C and
D, quantification of mitochondrial interconnectivity (C) and
mitochondrial elongation (D) in PINK1 knockdown clonal lines
transfected with the indicated siRNAs (representative of three experiments;
 , p < 0.05
versus control cell line transfected with control siRNA;
 , p < 0.01
versus PINK1 A4 or D14 transfected with control siRNA; n =
25-30 cells/condition). E, basal cell survival (Alamar Blue assay) of
control and PINK1 shRNA clones (representative of four experiments;
 , p < 0.005
versus control stable cell line; n = 8 wells
analyzed/condition). F, propidium iodide (PI) cell death
assay of control and PINK1 shRNA stable clonal cell lines
(
 , p < 0.05
versus control stable line; n = 800-1000 cells
analyzed/condition). G, cell survival of control or PINK1 shRNA
stable cell lines treated with bafilomycin or vehicle for 18 h (representative
of three experiments;
  ,
p < 0.05 versus control cell line/bafilomycin; n
= 4 wells analyzed/condition). H, cell survival of control or
PINK1shRNA cells transfected with Atg7 siRNA (representative of three
experiments;
  , p
< 0.05 versus control siRNA-treated clone A4;
 , p < 0.005
versus control siRNA-treated clone D14; n = 6 wells
analyzed/condition).

