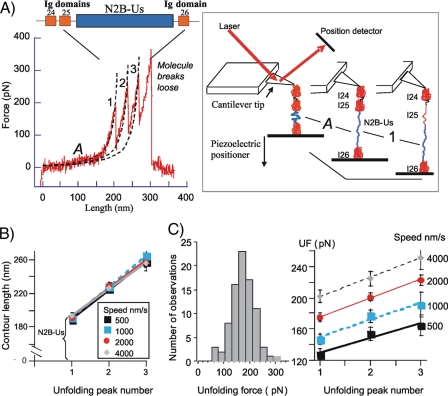
FIGURE 1.
Single molecule force spectroscopy of N2B-Us. A, example of force-extension curve of N2B molecule (stretch speed 1000 nm/s). Top, schematic of the N2B molecule. Blue, large unique sequence (N2B-Us); red, Ig domains. Bottom, as the molecule is stretched, force gradually increases at first and then more steeply (marked as phase A); when a force level of ∼150 pN is reached, force peaks appear. Broken lines, WLC fits. Right, schematic explaining main features of the force-extension curve(note that it is likely that any of the three Ig domains can unfold first). B, CL of the first three force peaks in the force-extension curves of molecules stretched at 500, 1000, 2000, and 4000 nm/s. CL of the first peak is assumed to be derived from the N2B-Us (∼195 nm), and the slopes of the lines are the average CL gain due to unfolding of single Ig domains (∼33 nm). Obtained values are independent of stretch speed. C, left, unfolding forcehistogram of the first unfolding peak (speed, 2000 nm/s). Right, average UF of peaks 1-3 at four stretch speeds. See “Experimental Procedures” for details.

