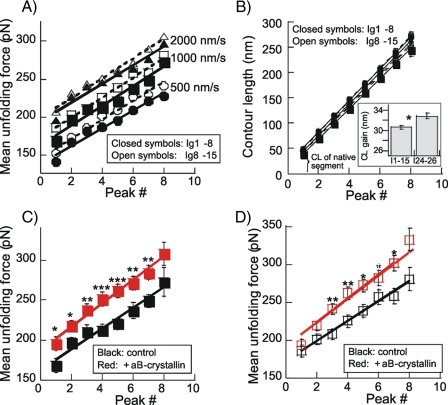
FIGURE 6.
A, UF of Ig 1-8 and Ig 8-15 at three stretch speeds. (Mean force levels of typically 30 molecules are shown.) Linear fits show that UF is ∼5-10 pN higher in Ig 8-15. B, CL of each of the eight unfolding peaks in Ig 1-8 and Ig 8-15. Results largely overlap. Results were fit with linear lines (r2 of each line was >0.99), shown as solid lines for Ig 1-8 and broken lines for Ig 8-15. The inset shows the mean and S.E. of all slopes of Ig 1-8 and Ig 8-15 (shown as Ig 1-15) and of Ig 24-26 (from Fig. 1B). C, effect of αB-crystallin on UF of Ig 1-8 (stretch speed, 1000 nm/s). UF is significantly increased by αB-crystallin. Lines, control, y = 173 + 12.9x; αB-crystallin, y = 188 + 14.7x. control, 31 molecules; αB-crystallin, 34 molecules. D, effect of αB-crystallin on UF of Ig 8-15 (stretch speed, 1000 nm/s). UF is significantly increased by αB-crystallin. Lines, control, y = 173 + 13.1x; αB-crystallin, y = 195 + 13.1x. control, 22 molecules; αB-crystallin, 25 molecules.

