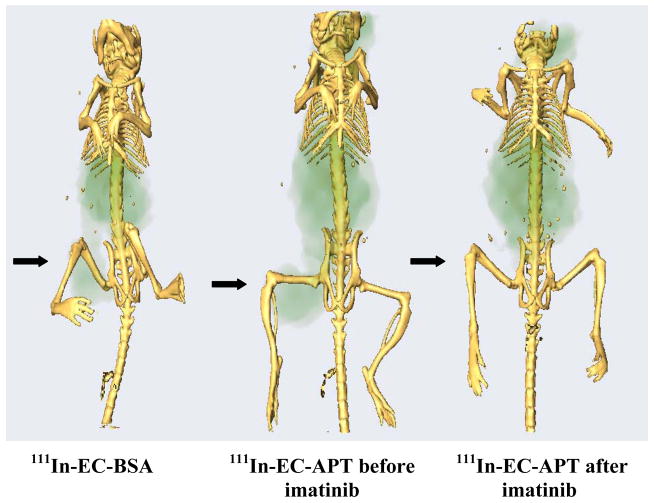
Figure 1.
48 hr iso-surface snap of SPECT-CT images comparing K562 tumor-bearing nude mice injected with 111In-EC-BSA or 111In-EC-APT before and after 5 days of imatinib treatment. Images were fused together using the Amira software, which allows visualization of bony structures in three dimensions. Left panel imaged with 111In-EC-BSA shows baseline levels of blood flow to the tumor (right leg). Middle panel imaged with 111In-EC-APT detects the phosphokinase. Right panel imaged with 111In-EC-APT after 5 days of imatinib shows down-regulation of the phosphokinase. Previous experiments have shown that radiolabeled isotypic control antibody does not image (8).

