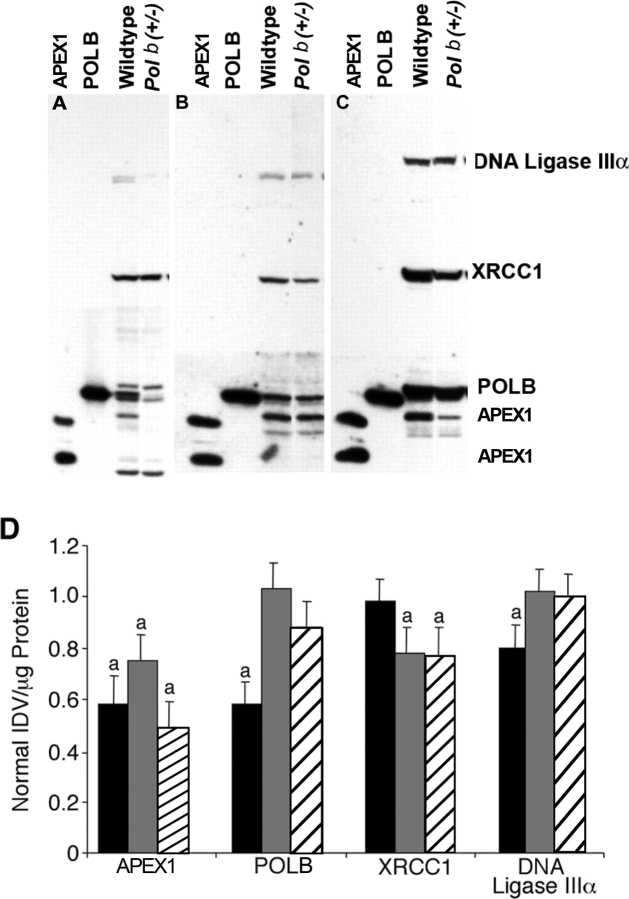
FIG. 1.
Western blot analysis. Western blot analysis of nuclear extracts prepared from mixed germ cells (MGC) (A), liver (B), and brain (C) obtained from wild-type control and Polb+/− animals. Each tissue was analyzed separately from other tissues. Alongside samples, lanes were also loaded with purified APEX1 and POLB as standards. APEX1 protein is distinct as two bands on MGC Western blots at 37 kDa and at 34 kDa. POLB is at 39 kDa, XRCC1 is at 69 kDa, and DNA ligase IIIα is at 93 kDa. D) Summary of Western blot quantification using nuclear extracts prepared from Polb+/− and wild-type mice. Data are given as mean ± SEM after normalization to values for wild-type controls. At least four animals were used per genotype. Bands were quantified as IDV per microgram of protein. Solid black bars, MGC; solid gray bars, liver; hatched bars, brain; and a, significantly different from wild-type control in same tissue.

