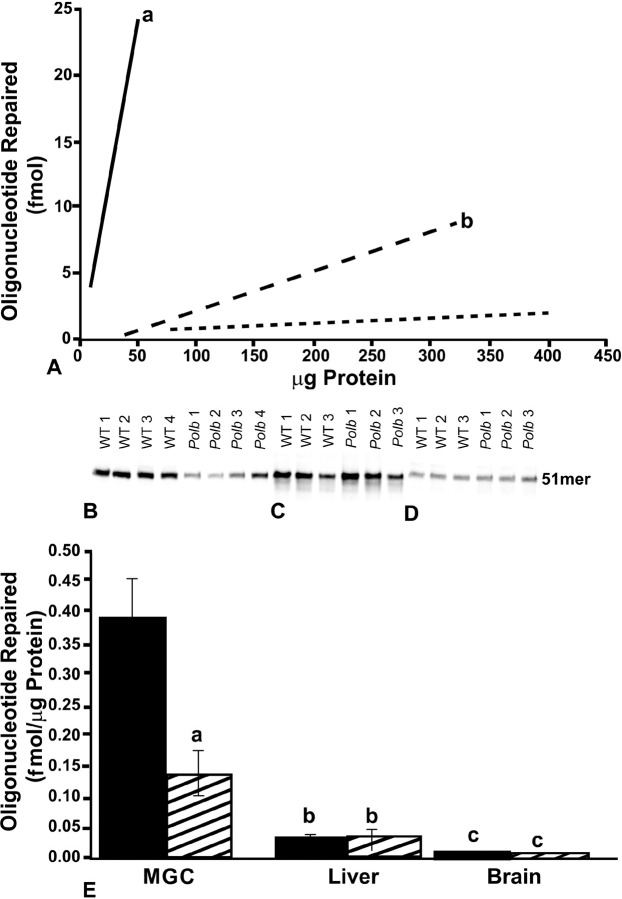
FIG. 2.
BER activity assay results. A) Linearity determinations for mixed germ cells (MGC), liver, and brain BER activities relative to protein concentration. The best-fit line is shown for wild-type control MGC (solid line), liver (long dashed line), and brain (short dashed line). a, significantly different from liver and brain; b, significantly different from brain. B–D) BER activities for nuclear extracts prepared from MGC (B), liver (C), and brain (D) obtained from wild-type (WT) control and Polb+/− animals. Forty micrograms of MGC nuclear extracts and 160 μg of liver and brain nuclear extracts were used. Results are given as mean ± SEM (E). Four animals were used per genotype for MGC and liver and three for brain. Results are from at least two replicate assays for each sample. Solid bars, control; hatched bars, Polb+/−; a, significantly different from wild-type control in same tissue; b, significantly different from MGC and brain same of genotype; and c, significantly different from MGC and liver of same genotype.

