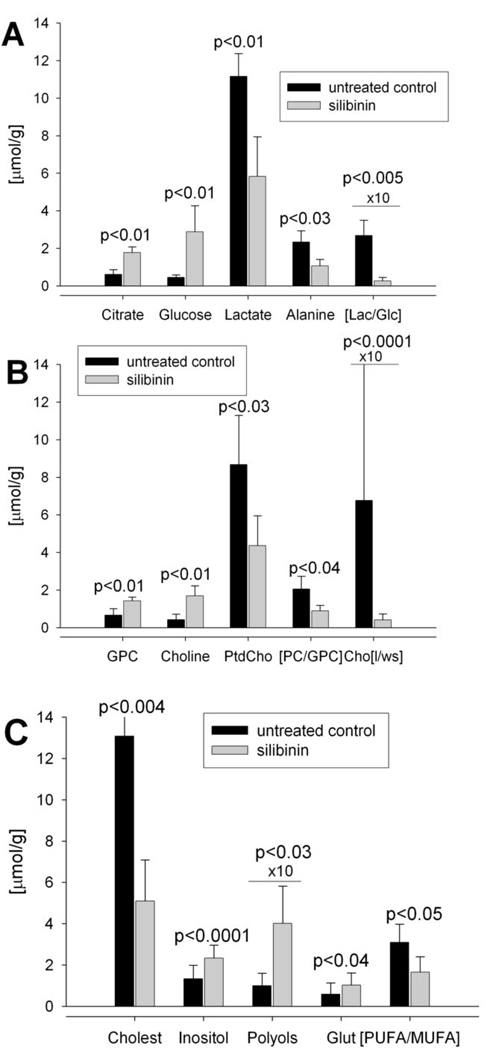
Fig. 2.
Validation of metabolites that were distinguished as biomarkers for metabolic changes following silibinin treatment (see Figure 1B). Panels A–C plot individual concentrations ([µmol/g] prostate tissue, n=4 for each data set) for each metabolite or metabolite ratios as calculated from 1H-NMR spectra of hydrophilic and lipophilic fractions (Table 1).

