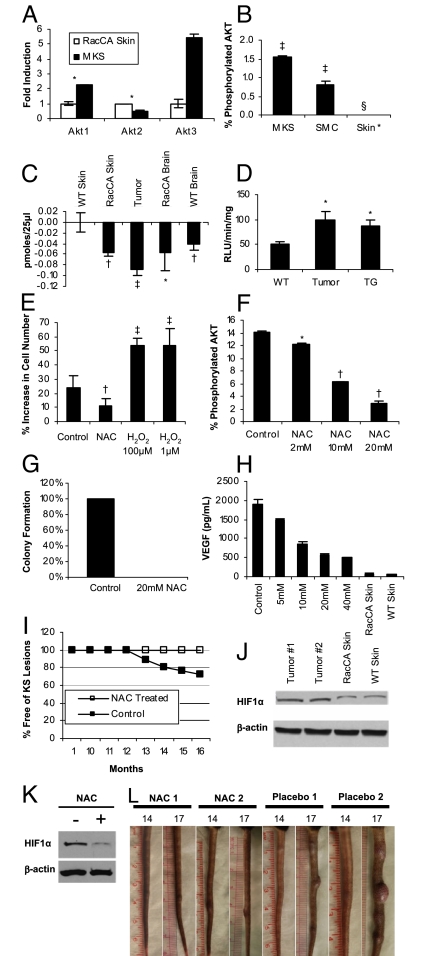
Fig. 5.
Causal role of ROS in RacCA tumorigenesis. (A) Up-regulation of AKT isoform gene expression in RacCA tumors compared with uninvolved adjacent tissues. Bars represent mean fold increase (triplicates ± SEM) in mRNA levels quantified by real-time quantitative RT-PCR. (B) AKT phosphorylation levels (as percentage of AKT phosphorylated/total AKT signal) in RacCA tumor compared with smooth muscle and skin tissue, as determined by MSD (duplicate ± SEM; see Materials and Methods). (C) Activities of immunoprecipitated PTEN from various tissues measured by release of free phosphate (see Materials and Methods) (triplicates ± SEM). (D) Lucigenin luminescence determination of (·O2−) production in the tumor tissue and adjacent skin tissue compared with the tail skin tissue from WT mice skin tissue (triplicates ± SEM). (E) Effects on cell proliferation of NAC (10 mM) or H2O2 (1 μM and 100 μM). Bars show percentage increase in cell number after 24 h of incubation (triplicates ± SEM). (F) Dose-dependent inhibition of AKT phosphorylation in cultured RacCA tumor cells by NAC (as percentage of AKT phosphorylated/total AKT signal) determined by MSD (duplicate ± SEM). (G) Effect of NAC (20 mM) on colony-forming ability of cultured RacCA tumor cells. (H) Dose-dependent reduction of VEGF secretion by 24 h of NAC treatment in cultured RacCA tumor cells. (I) Oral administration of NAC (10 mg/mL in drinking water) prevents tumor formation in homozygous RacCA mice. (J) Western blot showing increased HIF1-α level in RacCA tumor tissue (T1, T2). (K) NAC treatment (10 mM) reduced HIF1-α level in cultured RacCA tumor cells after 24 h. (L) Three months of oral administration of NAC after tumor onset (14 months) stabilized tumor progression. Significance was established by t test: *P < 0.05; †P < 0.01; ‡P < 0.001; §total AKT detection did not surpass background levels.

