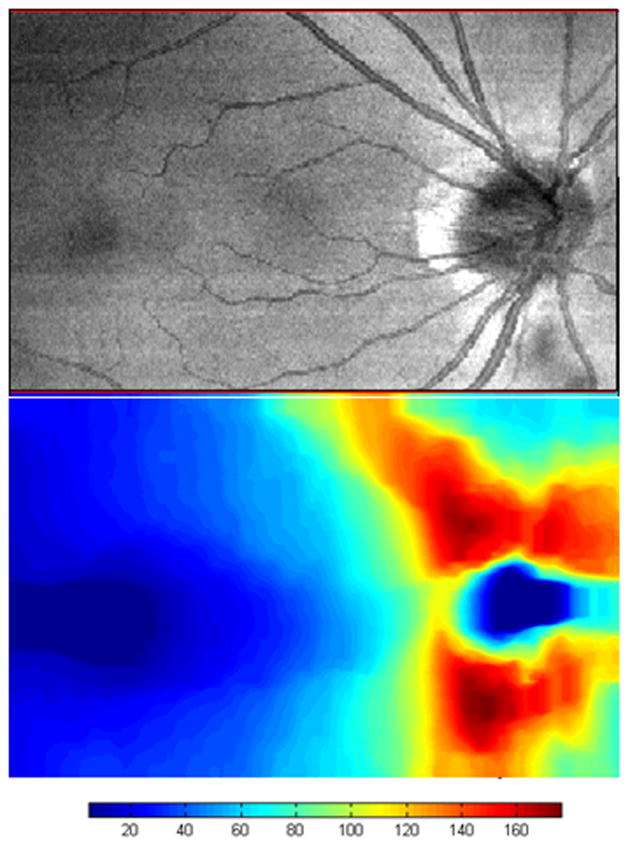
Figure 8.
Spectral domain optical coherence tomography (SDOCT) integrated reflectance image (top) and retinal nerve fiber layer thickness map (bottom) of the normal right eye of a 43-year-old white man. The image was scanned with a prototype SDOCT system with a titanium:sapphire laser (Femtolaser, Austria) with a central wavelength of 800 nm and a full width at half-maximum spectral bandwidth of about 140 nm with a 2.8-μm axial resolution. The scale is in microns. The foveal area is on the left, and the normal bowtie retinal nerve fiber layer thickness pattern is shown around the optic nerve head on the right. The area scanned is 8.85×5.73 mm.

