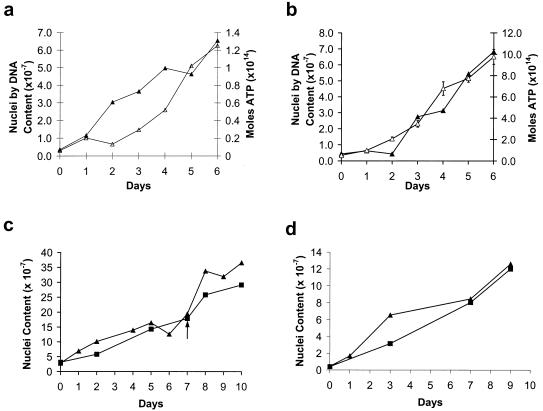
Figure 1.
Growth curves of P. carinii in axenic culture. Each data point in each curve represents an individual culture inoculated on day 0 and harvested at the indicated day. Three different means of growth assessment were used: total DNA (▴), total ATP (▵), and counts of P. carinii nuclei (■); when compared with other methods, the total DNA method always indicated the same overall rate of growth. The ATP scale differs in a and b because different methods of ATP extraction were used; because the extraction method used for b produced a more sensitive assay, it was possible to perform multiple analyses of the ATP for each culture, and error bars were calculated. After thawing and before being used to inoculate well inserts, the stock was grown for 21 days with 3 subcultures (a), 81 days with 9 subcultures (b), 88 days with 10 subcultures (c), and 96 days with 12 subcultures (d). The arrow in c indicates that an additional subculture was performed during the experiment; a dilution was made to reduce the cell concentration to the concentration on day 0, and subsequent time points were corrected by this dilution factor.

