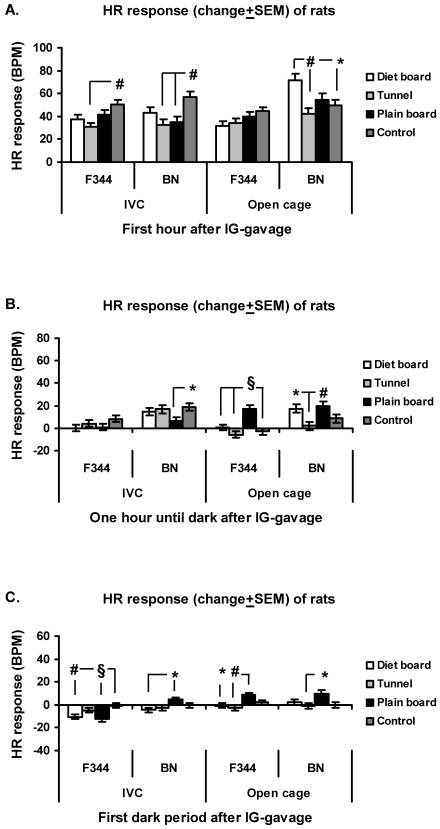
Figure 8.
HR response (change from baseline ± SEM) of rats to gavage in IVCs and open-top cages. (A) First hour after cage change. (B) From 1 h after cage change to start of dark period. (C) First dark period after cage change. The y axis scale is the same in all figures. Overall there are 16 experimental units, 4 animals in 4 rounds. *, P < 0.05; #, P < 0.01; §, P < 0.001.

