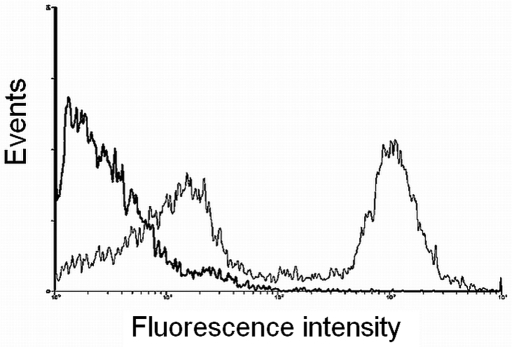
Figure 2.
Cells were treated with primary antibodies specific for rat neutrophils and FITC-conjugated secondary antibodies. The histogram shows the green fluorescence (530 nm bandpass) of the rat leukocytes (narrow line, 2 peaks). Cells untreated with primary antibodies were used as a negative control (wide line, 1 peak).

