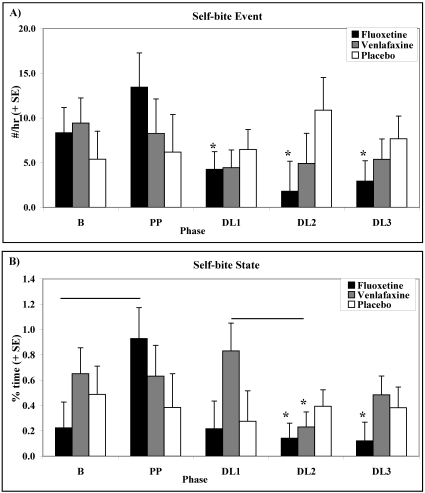
Figure 5.
Effects of dose level on (A) rates (mean ± SE) of self-biting and (B) percentage (mean ± SE) time spent self-biting among animals in the FLX-treated, VEN-treated, and PLC conditions. Horizontal bars represent P < 0.05 and * represent significant (P < 0.05) differences compared with averaged B and PP.

