
Fig. 16.
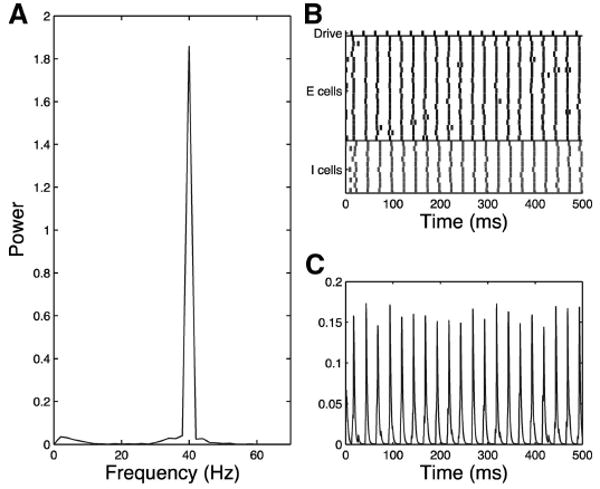
Simplified model trial, schizophrenic 40-Hz drive case, noise input to all cells, increased drive to excitatory cells (gde = 0.4, increased from gde = 0.3), τinh = 28. Schizophrenic network loses 20-Hz response to 40-Hz drive when strength of drive is increased as shown in the frequency diagram (A), raster plot (B), and simulated MEG trace (C).