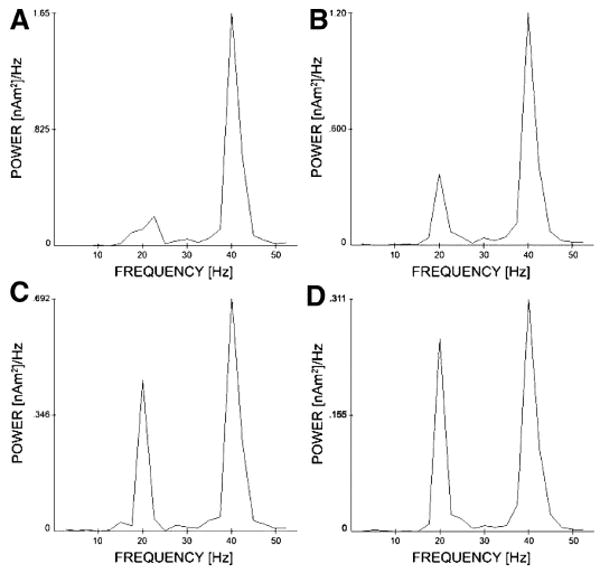
Fig. 9.

Activity of the schizophrenic GENESIS model for single trials stimulated at 40 Hz as τ2,b, the inhibitory decay constant of basket cell projections, is increased. The figure shows the power spectra of model oscillatory activity for basket cell τ2,b of 8 ± 4 ms (A), 10 ± 5 ms (B), 15 ± 7.5 ms (C), and 20 ± 10 ms (D) where values are chosen from a uniform distribution. Graphs are plotted normalized to the 40-Hz peak.
