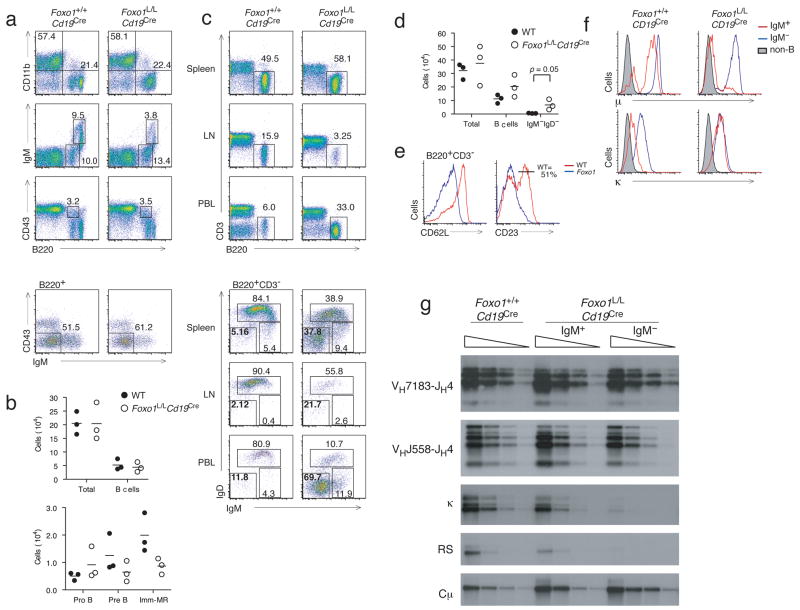
Figure 4. Foxo1 regulates kappa chain gene rearrangement in pre-B cells.
(a) Representative FACS profiles from Foxo1+/+Cd19Cre and Foxo1L/LCd19Cre mice indicating percentages of total B cells, immature and mature B cells, pro-B cells, and pre-B cells. (b) Quantitation of bone marrow B cell subsets from n=3 mice per group (indicated by symbols) and average numbers of each group (indicated by dashes). (c) Representative FACS profiles indicating percentage of B cells and IgM and IgD expression on B220+ B cells from the spleen, peripheral blood, and lymph node. (d) Quantitation of splenic B cell subsets from n=3 mice per group (indicated by symbols) and average numbers of each group (indicated by dashes). (e) Expression of CD21 and CD23 maturation markers on splenic B cells from Foxo1+/+Cd19Cre and Foxo1L/LCd19Cre mice. (f) Expression of intracellular μ heavy chain and κ light chain in splenic IgM+ (red), IgM− (blue) B cells, and non-B cells (shaded gray). (g) Representative southern blot analysis of 3 independent experiments of proximal and distal VH(DH)JH rearrangement, Vκ-Jκ rearrangement, Vκ to RS rearrangement, and cμ control in IgM+ and IgM− B cells. FACS plots are representative of 3 mice/group.

