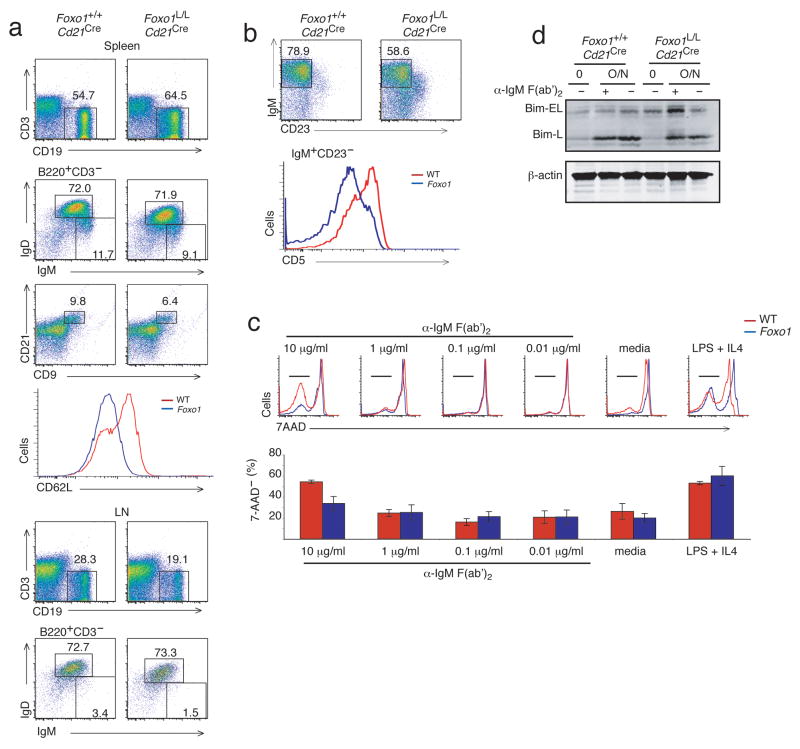
Figure 5. Reduced lymph node and peritoneal B-1a cells in Foxo1L/LCd21Cre mice.
(a) Representative FACS profiles of spleen and lymph node from Foxo1+/+Cd21Cre and Foxo1L/LCd21Cre indicating the percentages of B cells of total cells and the percentage of B cells that are IgM+IgD+ or CD9+CD21+ marginal zone B cells. Representative FACS profile of the expression level of CD62L on B cells in the spleen. (b) FACS profiles indicating the percentage of IgM+CD23− B-1 cells and CD5+ B-1a vs CD5− B-1b subsets from the peritoneal cavity of Foxo1+/+Cd21Cre (red) and Foxo1L/LCd21Cre (blue) mice. (c) Stimulation of purified splenic B cells from Foxo1+/+Cd21Cre (red) and Foxo1L/LCd21Cre (blue) mice with titrated amounts of anti-IgM F(ab′)2 (48 h) and measurement of cell viability using 7AAD. Data is representative of triplicate stimulations done in 3 independent experiments (d) Immunoblot analysis for Bim expression in purified splenic B cells stimulated overnight with or without 10 μg/mL of anti-IgM F(ab′)2. FACS plots are representative of 3 mice/group.

