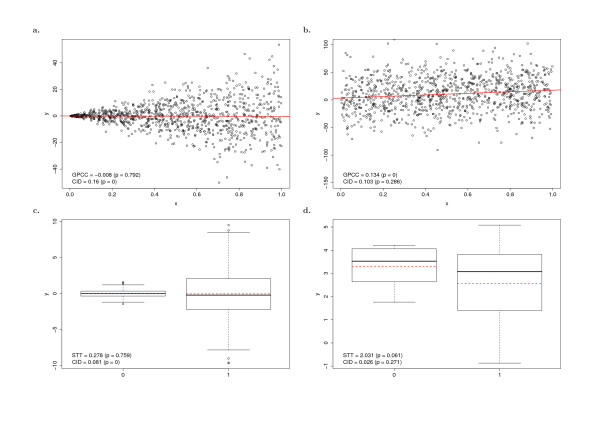
Figure 3.
The brief demonstration of the selected situations when CID, GPCC, and STT evaluate the significance differently based on the same data distribution. (a)-(b) represent when variables are continuous and thus the CID analysis is compared with GPCC. (c)-(d) represent when one of the variables is discrete and thus the CID analysis is compared with STT.

