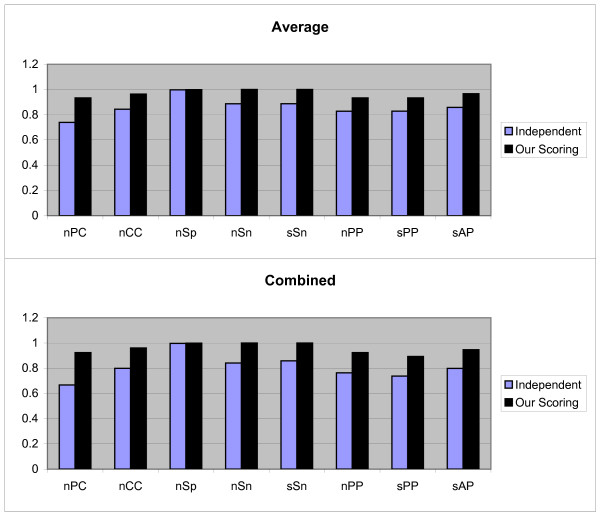
Figure 4.
Results obtained form two independent and our scoring schemas, by the first test method on 'algorithm-Markov' sandve's benchmark. These results include nPC, nCC, nSp, nSn, nPP sPP, and sAP values as shown in X axis. Y axis is numerically scaled based on 0.2 unit for these values. In this figure, results obtained by Average and Combined methods are shown from top to down respectively.

