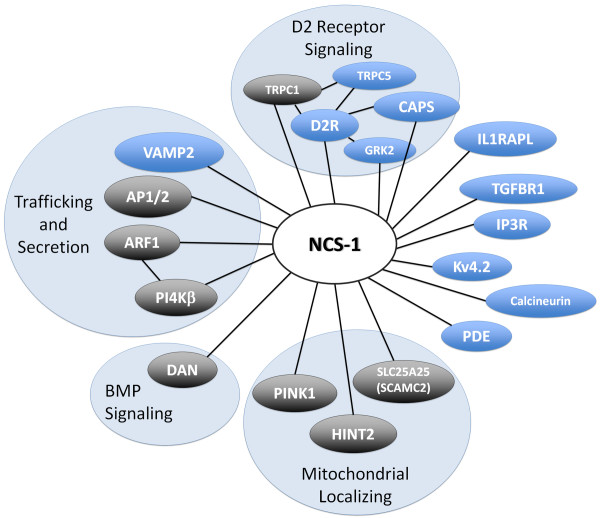
Figure 6.
NCS-1 interaction map. Web of newly identified and previously known NCS-1 binding partners. Interaction map was adapted from Haynes et al. 2006 [33]. NBPs were grouped based on previously characterized functional properties or cellular localization. NBPs depicted in gray shaded ovals are those whose genes are expressed within the developing zebrafish inner ear.

