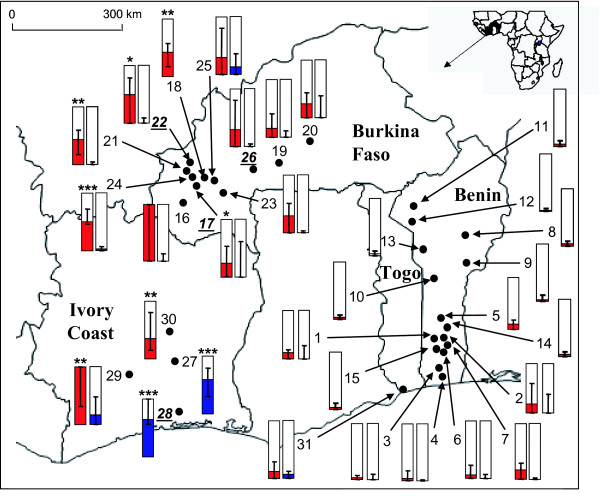
Figure 1.
Ag-ace-1D frequency in Western Africa. The frequency of Ag-ace-1D is given for each An. gambiae molecular form: M (red) and S blue). Samples are described in Table 1. Samples in which Ag-ace-1D was detected by molecular analysis are bolded and underlined (Table 2). Significant presence of the duplicated allele (before Bonferroni correction, see Methods) is given with * for P < 0.05, ** for P < 0.01 and *** for P < 0.001.

