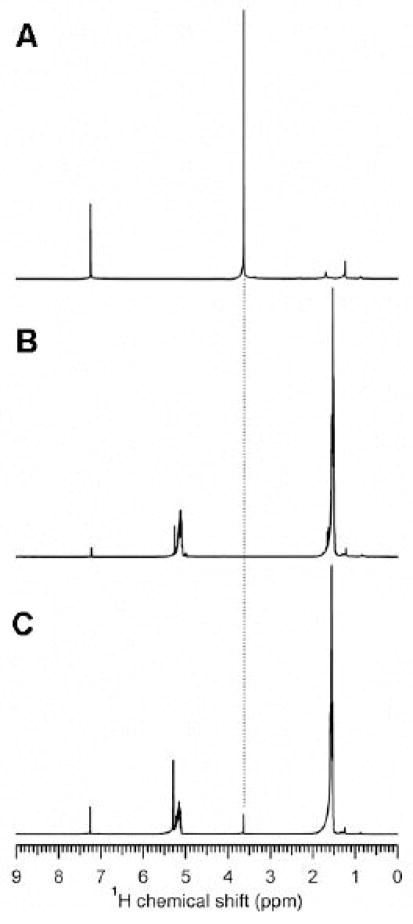
Figure 4.
(A) 1H NMR of mPEG5000-DSPE in CDCl 3. Note the peak at ~3.6 ppm which is from ethylene glycol -CH2- protons. This is the peak of interest that is integrated to determine the amount of PEG-lipids. (B) Spectra of PLA in CDCl3 confirm there is no interference with the PEG signal. (C) Spectra of mPEG2000-DSPE MPs dissolved in CDCl3 show the expected peaks from both PLA and PEG-lipid.

