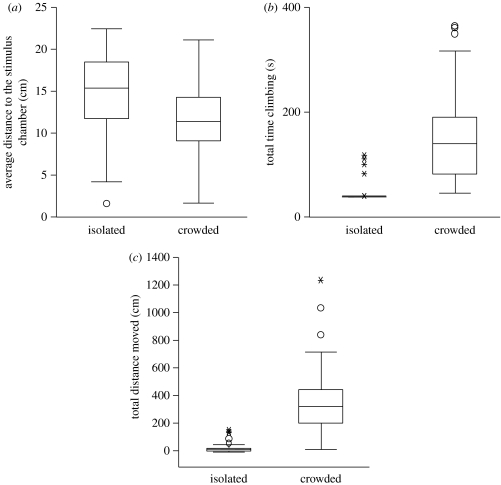
Figure 1.
Box plots representing (a–c) the behavioural variables retained in the logistic regression model from 78 crowd-reared and 78 third-generation isolated-reared C. terminifera fifth-instar nymphs. Each box displays the median value, with the ends of boxes representing the 25th and 75th percentiles and the ends of the whiskers representing the 10th and 90th percentiles. Circles, outliers; asterisks, extreme outliers.

