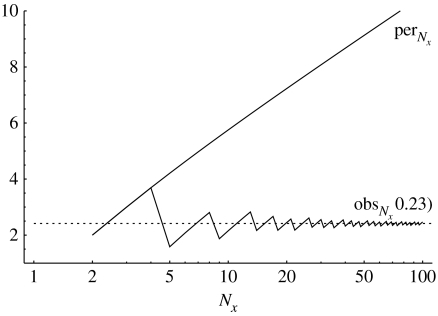
Figure 1.
Values of (written as ), the expected number of generations a site heteroplasmy persists, and of , the expected number of generations the site heteroplasmy are observable with threshold θ=0.23 (plotted on a logarithmic scale). Note that converges to the constant value 2 ln(θ−1−1)=2.417 (dotted line), while (solid line) grows logarithmically as Nx increases.

